
Inflation, compounding and real returns: personal finance basics for Indian earners
Official data on what inflation does to savings, how compounding and tax change a headline return, where Indian households put their money and this quarter's small savings rates, with a calculator for your own real return.

Key takeaways
- All-India CPI inflation was 5.54% in September 2026 (provisional), up from 2.74% in January; RBI puts average inflation for 2025-26 at 2.1%.
- The average CPI rose about 62% from 2014-15 to 2024-25, roughly 4.9% a year; at that rate ₹1 lakh buys what ₹61,979 buys today after 10 years.
- An assumed 8% return taxed at 20.8% every year leaves about 0.75% a year after 5.54% inflation; at 31.2% tax the real return turns slightly negative.
- Households saved 21.3% of GNDI in 2024-25, mostly in physical assets; new borrowing reached 6.4% of GNDI in 2023-24 before easing to 4.8%.
- Small savings rates for October to December 2026 are unchanged; SEBI lists an emergency fund and insurance cover among things to have before investing.
Retail inflation in India was 5.54% in September 2026. That is the provisional year-on-year rise in the all-India Consumer Price Index (CPI), released by the National Statistics Office (NSO) of the Ministry of Statistics and Programme Implementation (MoSPI) on 12 October 2026, and it is the highest of the nine monthly readings published so far on the new CPI series (base 2024=100). It follows a year of low inflation: the Reserve Bank of India (RBI) puts average CPI inflation for 2025-26 at 2.1%.
Inflation is the quiet line item in every household budget. Between 2014-15 and 2024-25, the average level of the CPI rose by about 62%, or roughly 4.9% a year. Money that sits idle loses buying power at that pace, and money that is invested has to earn more than inflation, after tax, just to hold its value. At the same time, RBI data show households taking on more new borrowing relative to what they save, and moving new financial savings slowly away from bank deposits towards provident funds, government claims and market instruments.
This analysis puts the official numbers in one place: the CPI series and what it does to ₹1 lakh, how compounding works for and against you, how tax and inflation turn a headline return into a real return, where Indian households actually put their savings, and the current small savings rates. It ends with the basics that SEBI, RBI and IRDAI ask people to have in place before investing, and a calculator for your own numbers. The bottom line: judge any return by what is left after tax and after inflation, and put an emergency fund and adequate insurance in place before taking investment risk. Nothing here is investment advice, and no product is recommended.
Inflation: what the official numbers show
The CPI tracks the prices of a basket of goods and services bought by households. According to the September 2026 CPI press release, NSO field staff collect prices on a weekly roster from 1,407 urban markets (including online markets) and 1,465 villages covering all states and union territories. The inflation rate is the percentage change in the index over the same month a year earlier.
| All-India CPI, base 2024=100 | Rural | Urban | Combined |
|---|---|---|---|
| CPI inflation, August 2026 (final) | 5.24% | 4.31% | 4.83% |
| CPI inflation, September 2026 (provisional) | 6.08% | 4.88% | 5.54% |
| Food inflation (Consumer Food Price Index), September 2026 | 8.06% | 7.18% | 7.74% |
Inflation on the new series has risen every month in 2026: 2.74% in January, 3.21% in February, 3.40% in March, 3.48% in April, 3.93% in May, 4.38% in June, 4.45% in July, 4.83% in August and 5.54% in September (Annexure IV of the September release; the September figure is provisional). MoSPI says the October 2026 index will be released on 12 November 2026.
A new series from January 2026
From January 2026, MoSPI publishes the CPI on a new base year, 2024=100. RBI’s Annual Report 2025-26 notes that the new series is not strictly comparable with the old one (base 2012=100) because of changes in methodology, sample size and collection techniques. For 2025-26 as a whole, RBI computed inflation of 2.1% as the average of the monthly rates, using the old series for April to December 2025 and the new series for January to March 2026 (Appendix Table 4).
Eleven years on one basis
To see a longer stretch on a consistent footing, we took MoSPI’s published monthly all-India index on the old base (2012=100), available on its eSankhyiki portal, and compared the average index for each financial year with the year before. That method reproduces the figures RBI reports for 2023-24 (5.4%) and 2024-25 (4.6%).
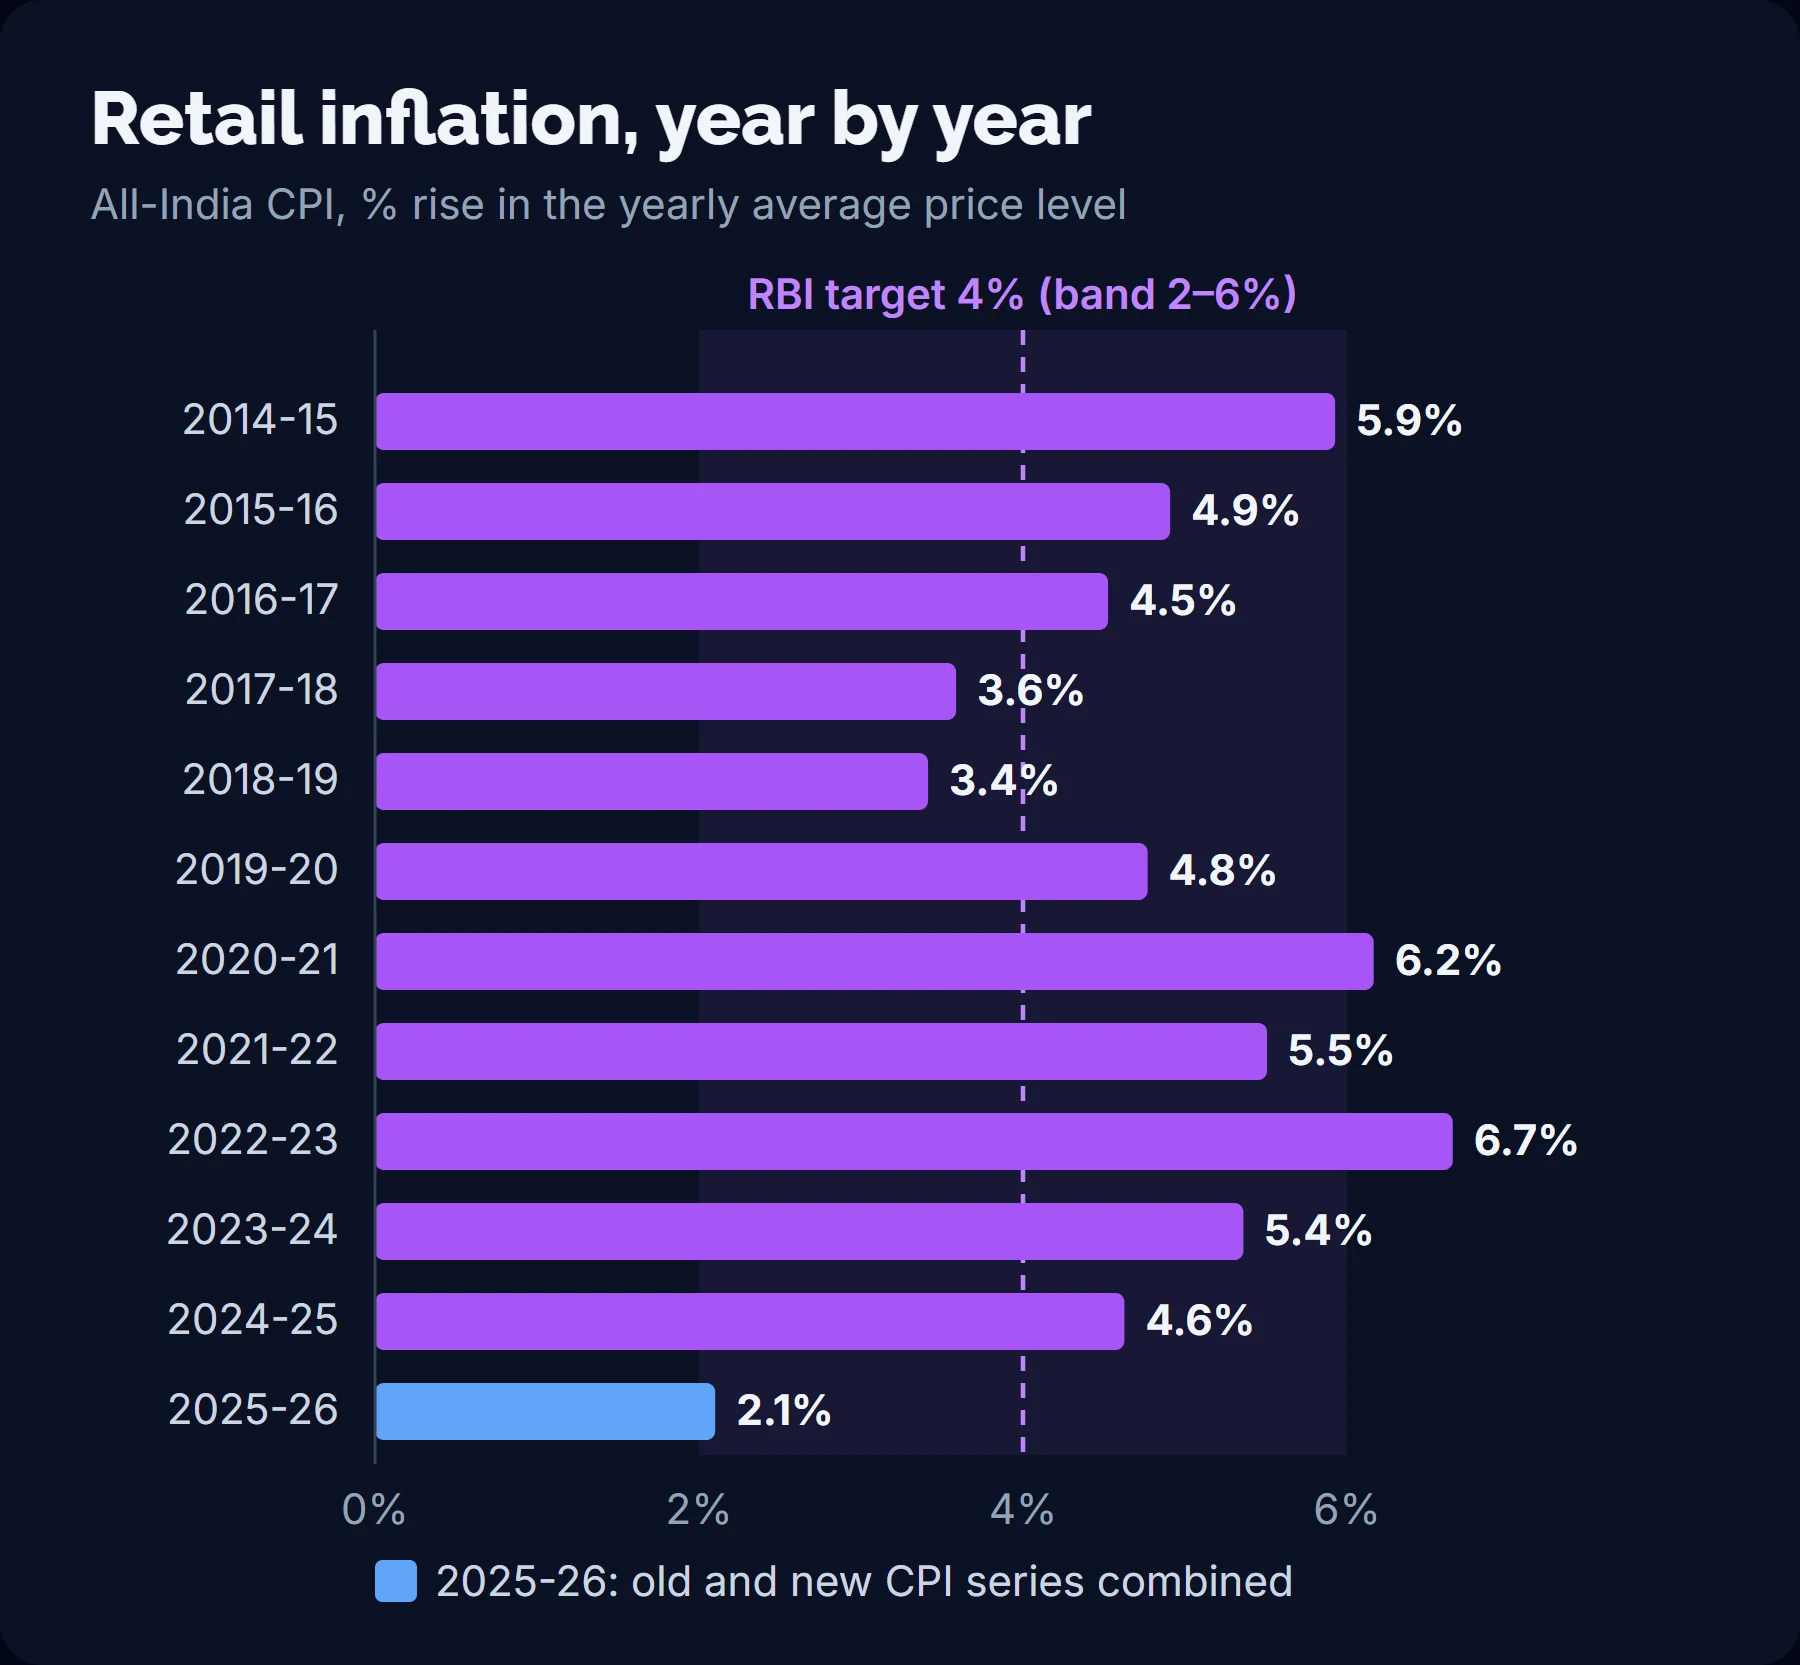
Three things stand out. Inflation crossed 6% in only two of these years, 2020-21 (6.2%) and 2022-23 (6.7%). It was lowest on the old series in 2017-18 and 2018-19, at 3.6% and 3.4%. And 2025-26, at 2.1%, was lower than any year before it in the chart. RBI’s Annual Report also records that, by a Gazette notification of 25 March 2026 (S.O. 1580(E)), the Central Government retained the CPI inflation target at 4%, with an upper tolerance level of 6% and a lower tolerance level of 2%, for 1 April 2026 to 31 March 2031.
What ₹1 lakh buys
The average index for 2024-25 was 192.62, against 118.85 for 2014-15: 1.62 times higher. A basket of goods and services that cost ₹1,00,000 in 2014-15 cost about ₹1,62,067 a decade later, and the compound rate behind that rise is about 4.9% a year. The chart below applies that rate forward. It is not a forecast; it shows what inflation of that size does to money over a working life.
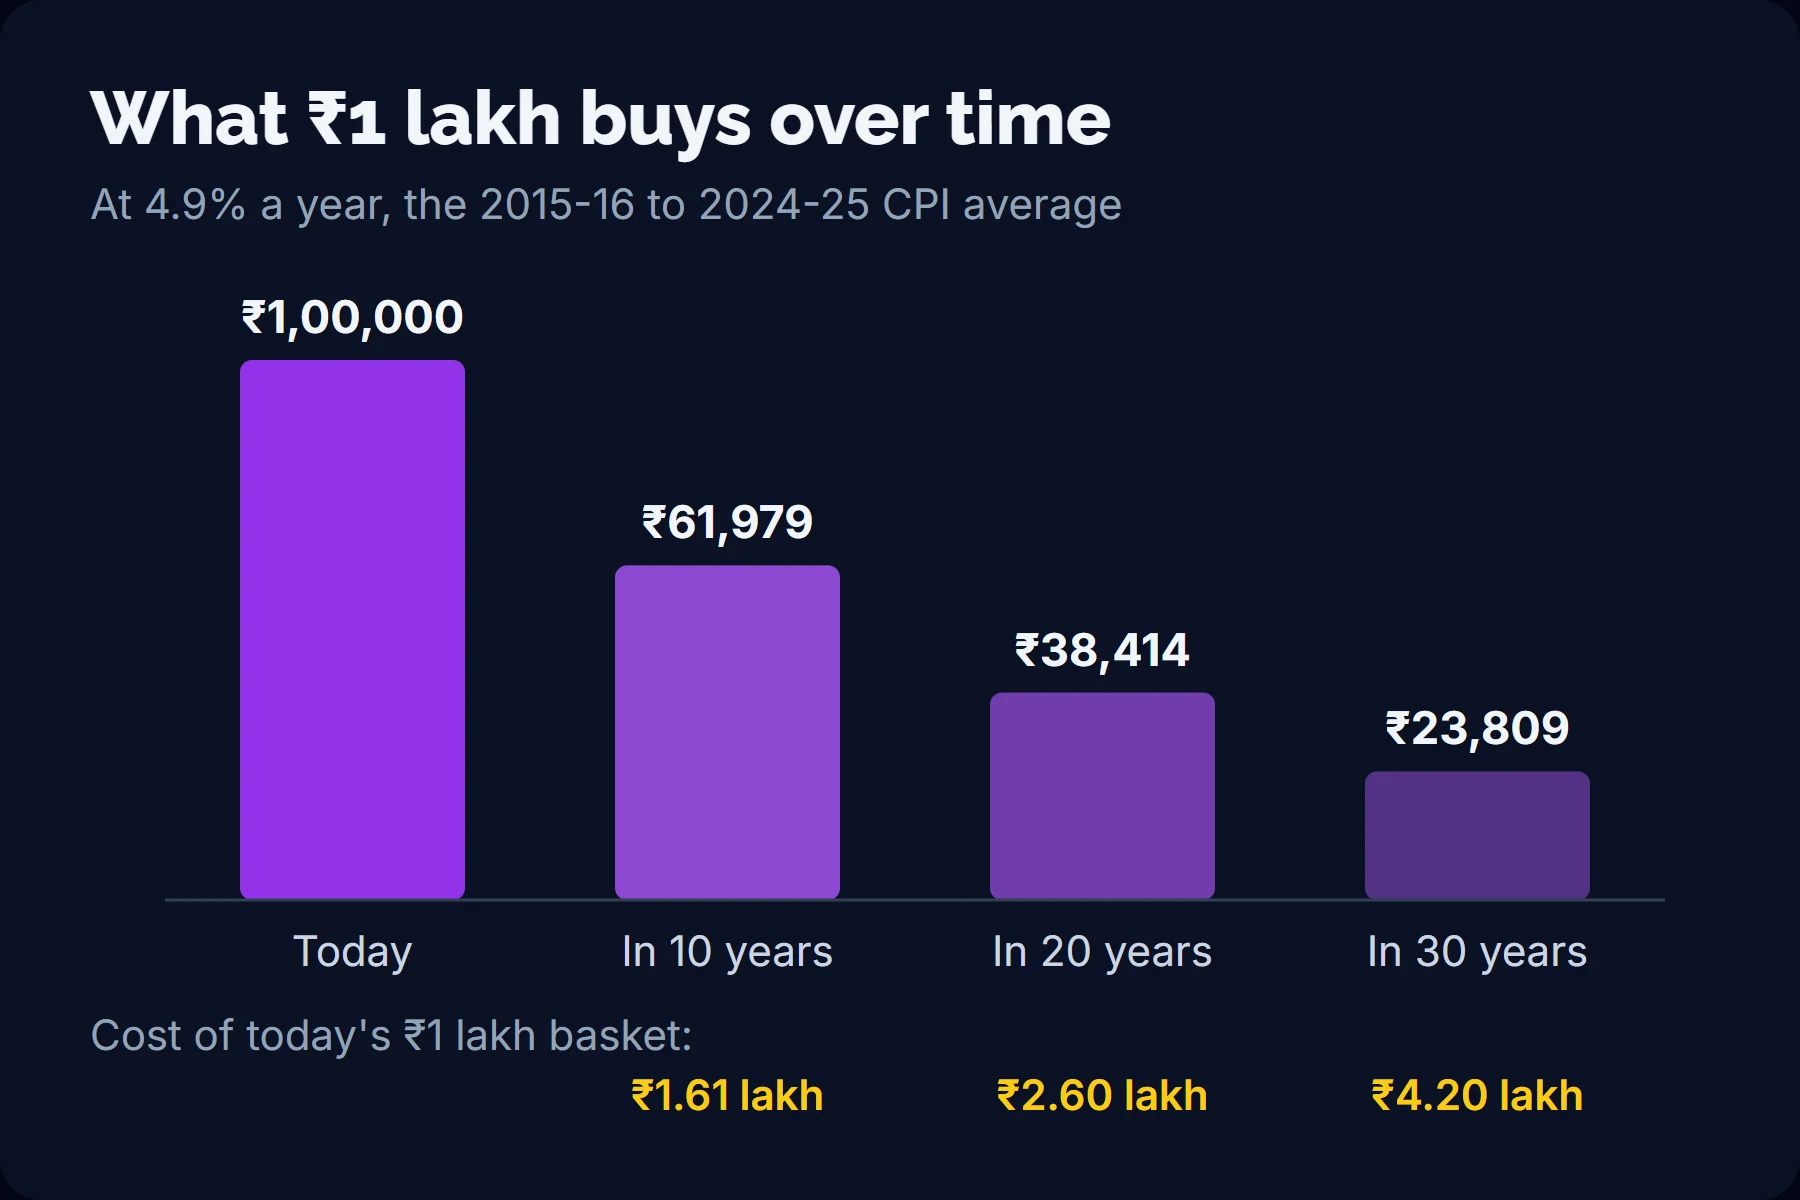
At 4.9% a year, prices double in about 14.5 years; at September 2026’s 5.54%, in about 12.9 years. SEBI’s Financial Education Booklet gives a shortcut for this, the Rule of 72: divide 72 by the annual rate to get the approximate number of years it takes money to double. The same shortcut works for prices. Seventy-two divided by 4.9 gives about 14.7 years, close to the exact figure.
Your own inflation rate
The headline CPI is an average over a national basket, and its parts move very differently. In September 2026, MoSPI’s division-wise inflation ranged from 1.40% for health and 2.74% for housing, water, electricity, gas and other fuels to 9.36% for restaurants and accommodation services and 13.75% for personal care, social protection and miscellaneous goods and services. Food and beverages were at 7.36%. In practice, this means a household that spends more on the faster-rising items faces a higher personal inflation rate than the headline, and a goal tied to a particular kind of spending may need its own inflation assumption.
Compounding works both ways
Compounding means earning a return on earlier returns as well as on the original amount. Both regulators teach it with simple examples:
- SEBI’s booklet shows ₹1,000 invested at 9% a year, with returns reinvested, growing to ₹31,409 in 40 years. With simple interest of ₹90 a year, the same ₹1,000 reaches only ₹4,600.
- RBI’s Financial Awareness Messages (FAME) booklet shows ₹10,000 at 10% simple interest becoming ₹20,000 in 10 years, while 10% compounded quarterly gives ₹26,851, which RBI describes as 34% more.
The same arithmetic runs against savers. Inflation compounds: 4.9% a year over ten years is not 49% but about 61%. And interest on a loan balance that is not paid down compounds in the same way as interest on savings. The direction depends on which side of the arithmetic you are on.
Starting early
Time does more of the work than the rate. The chart below uses round, illustrative numbers: ₹10,000 a month, an assumed 8% a year, no tax, and no adjustment for inflation. It is not a projection of any investment.
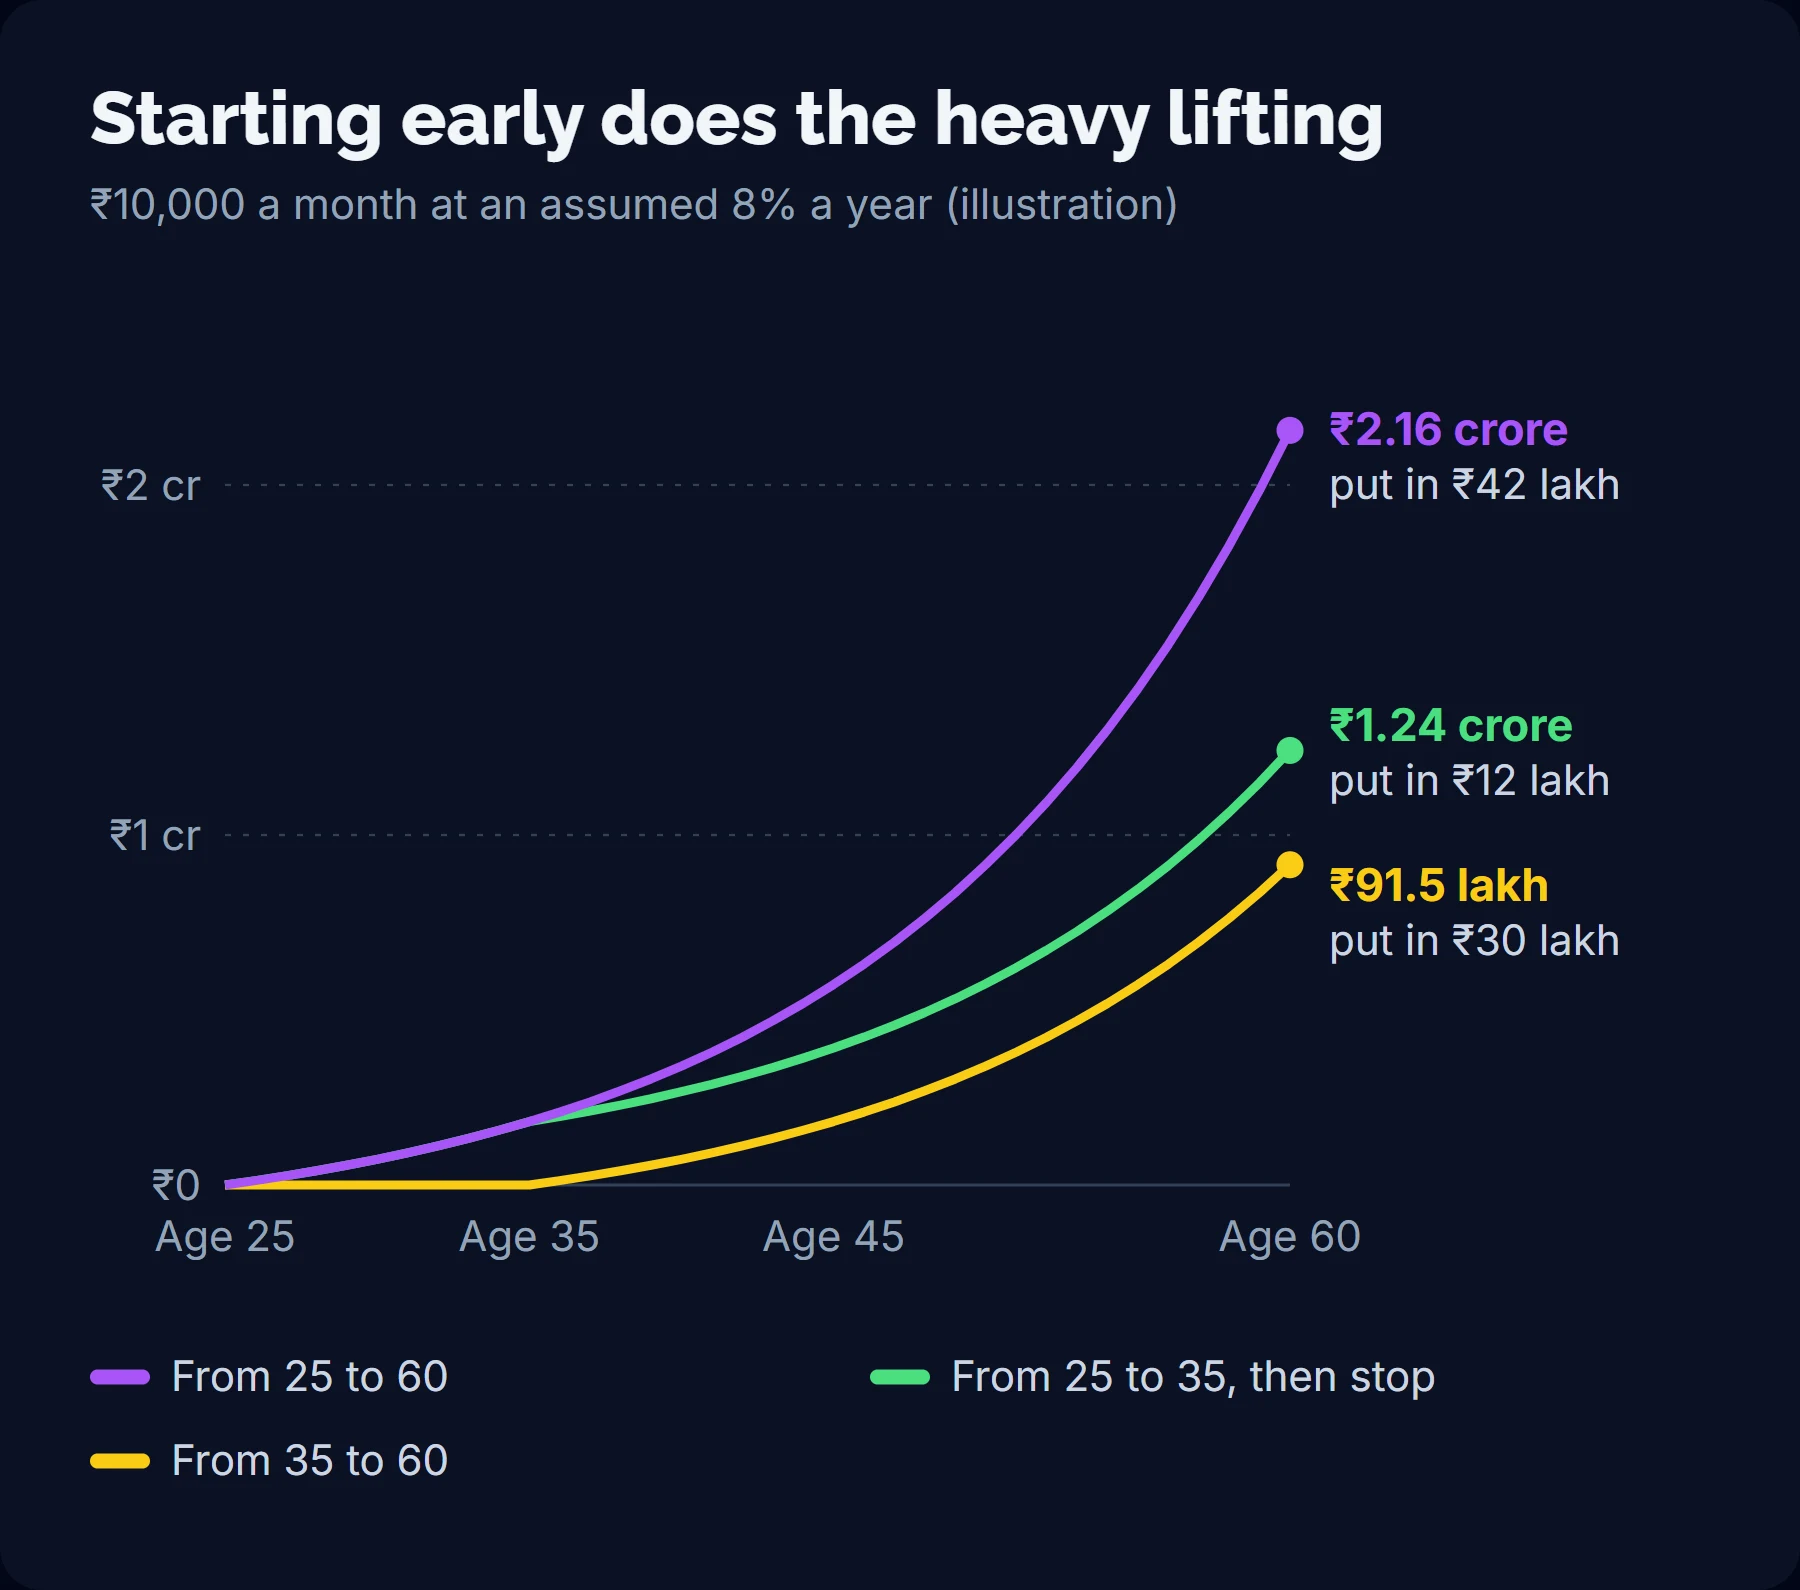
- Investing from 25 to 60 puts in ₹42 lakh and ends at about ₹2.16 crore.
- Investing from 35 to 60 puts in ₹30 lakh and ends at about ₹91.5 lakh.
- Investing only from 25 to 35 and then stopping puts in ₹12 lakh and ends at about ₹1.24 crore, more than the person who started at 35 and kept going for 25 years.
These amounts are in the rupees of the year the investor turns 60. Deflated at 4.9% a year for 35 years, ₹2.16 crore is about ₹40.4 lakh in today’s rupees, ₹1.24 crore about ₹23.3 lakh and ₹91.5 lakh about ₹17.1 lakh. That is not an argument for starting later; it is a reminder to read every long-term figure in today’s rupees. SEBI’s investor website makes the same point about starting early: the earlier you begin, the longer the money has to grow and compound, and the first income, even pocket money or a stipend, is the time to start (Importance of Investing Early).
Real return: after tax and after inflation
The rate printed on a product is a nominal return. What matters to a household is the real return: what the money can buy at the end compared with what it could buy at the start. RBI’s FAME booklet illustrates this with money deposited at 6% when inflation is 4% (a real return of 2%) and cash held at home (a real return of −4%), and adds a case where an investment earns 5% while inflation is 7%, so the money loses value. SEBI’s booklet asks investors to work out their real rate of return and to invest at a rate equal to or higher than inflation.
The arithmetic
Subtracting inflation from the return, as RBI’s examples do, is a good approximation. The exact version divides: real return = (1 + return after tax) ÷ (1 + inflation) − 1. The gap between the two is small at low rates and grows as rates rise. The calculator in this piece uses the exact formula.
Where tax comes in
Tax is charged on the return, not on the money you put in, so it comes off before inflation is considered. How a particular return is taxed depends on what kind of income it is and on the investor’s total income, and this piece does not cover the rules for individual products. What the law does fix is the rate structure. Under section 202(1) of the Income-tax Act, 2025, which applies from 1 April 2026, the total income of an individual is taxed at these rates unless the individual opts out under section 202(4):
| Total income in the tax year | Rate under section 202(1) | With 4% cess |
|---|---|---|
| Up to ₹4,00,000 | Nil | Nil |
| ₹4,00,001 to ₹8,00,000 | 5% | 5.2% |
| ₹8,00,001 to ₹12,00,000 | 10% | 10.4% |
| ₹12,00,001 to ₹16,00,000 | 15% | 15.6% |
| ₹16,00,001 to ₹20,00,000 | 20% | 20.8% |
| ₹20,00,001 to ₹24,00,000 | 25% | 26% |
| Above ₹24,00,000 | 30% | 31.2% |
Section 3(15) of the Finance Act, 2026 adds a Health and Education Cess of 4% of income-tax and surcharge for the tax year starting 1 April 2026, which gives the third column. Those are rates on the last rupee of income in each slab, before any rebate or surcharge. Because rebates, surcharge, the option to leave the section 202 rates and product-specific rules can all change the answer, the calculator asks for your own rate instead of assuming one. Check how a particular return is taxed with a tax adviser.
Tax every year or tax at the end
Some returns are taxed as they arise; others only when the investment is sold or withdrawn. When tax is deferred, the part that would have gone in tax keeps compounding. On the worked example’s assumptions below, paying 20.8% once on the total gain after 10 years instead of every year raises the value in today’s rupees from ₹1,07,803 to ₹1,11,853. This is arithmetic, not a statement about any product; which pattern applies is a tax question.
Worked example
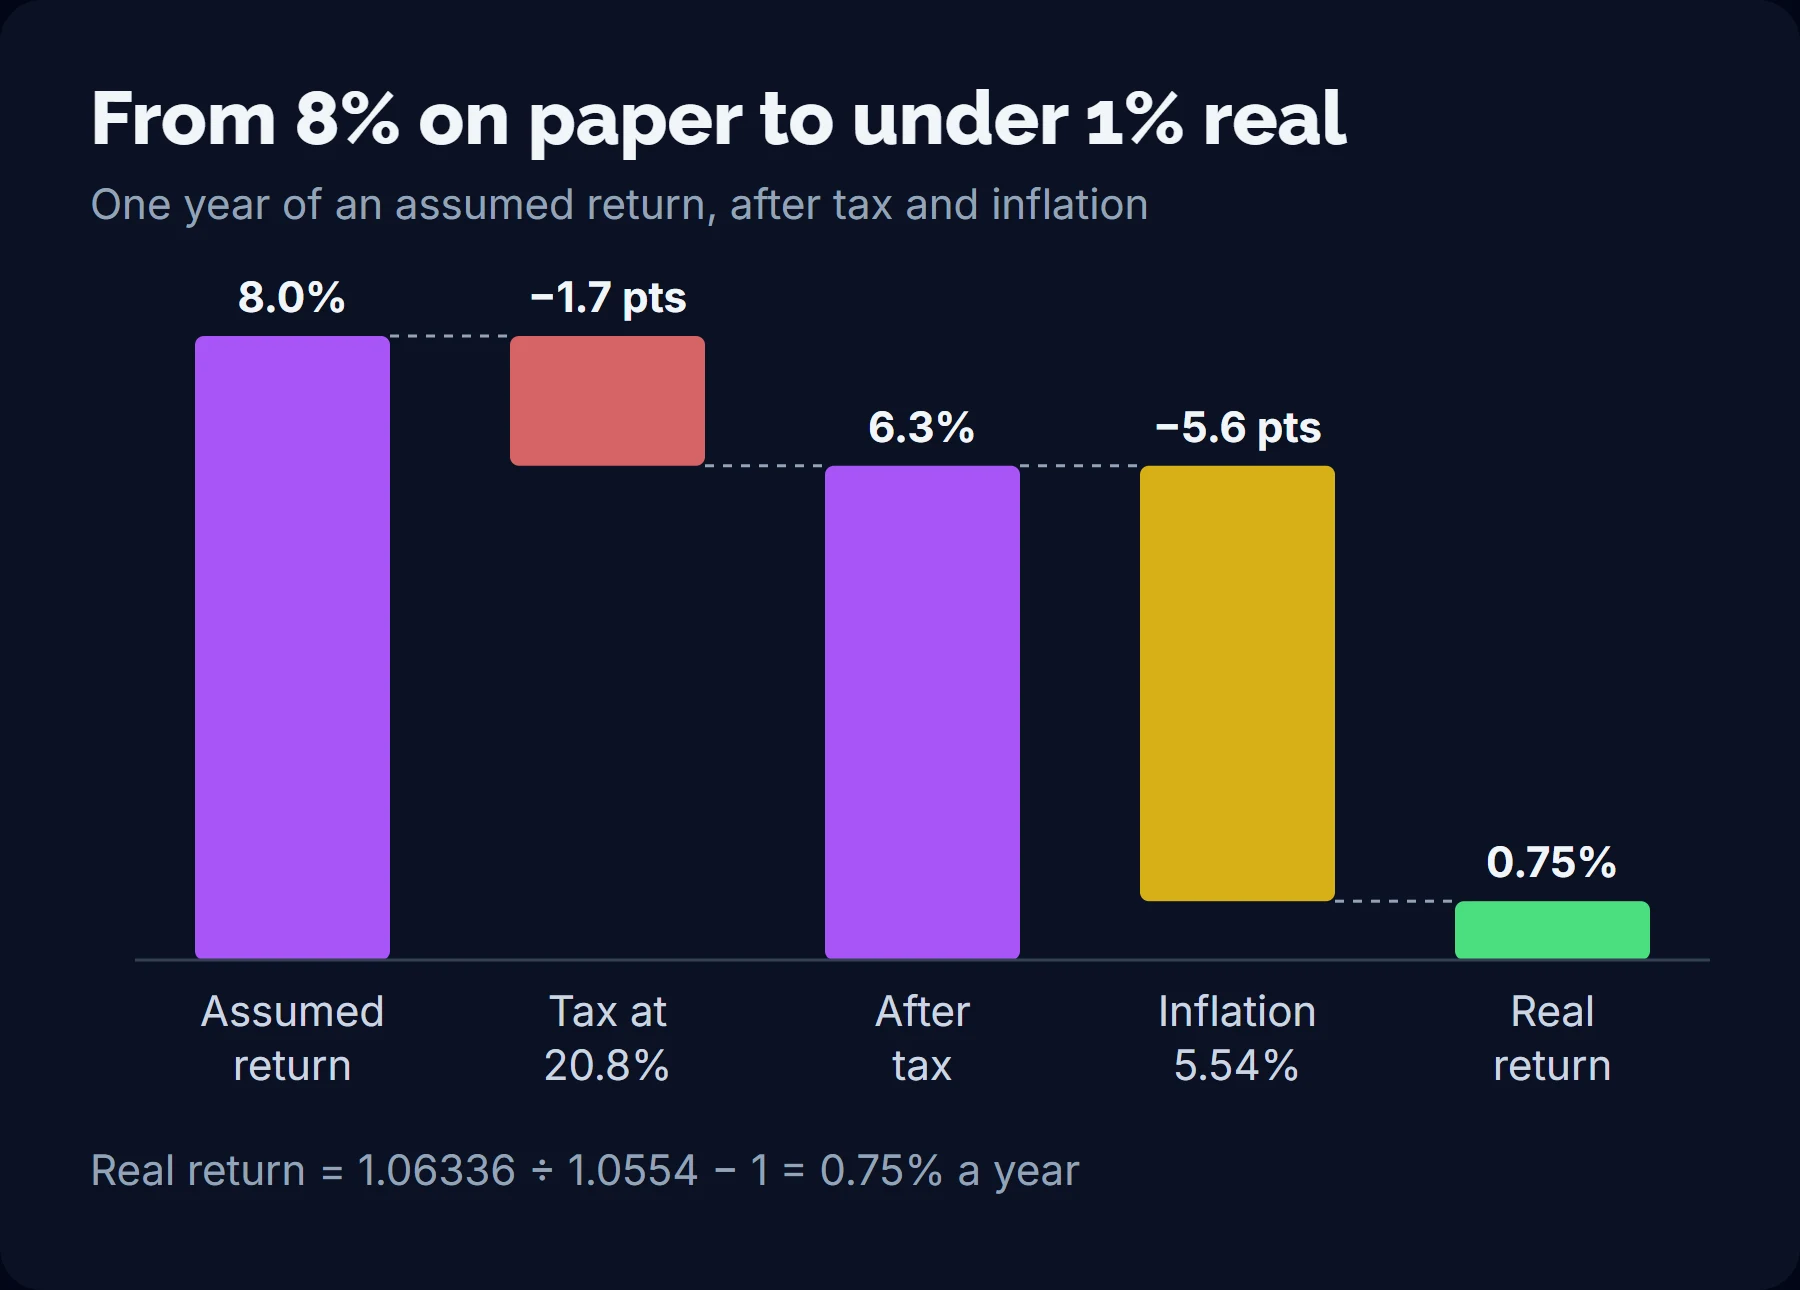
Take ₹1,00,000 invested today for 10 years, with nothing added. Assume a return of 8% a year before tax, a tax rate of 20.8% on that return paid every year (the 20% slab plus 4% cess), and inflation of 5.54% a year, the September 2026 CPI figure. All three are assumptions for illustration, and they are the calculator’s opening values.
- Return after tax: 8% × (1 − 0.208) = 6.336% a year.
- Value after 10 years: ₹1,00,000 × 1.06336¹⁰ = ₹1,84,843.
- Price level after 10 years at 5.54%: 1.0554¹⁰ = 1.7146, so prices rise by about 71%.
- Value in today’s rupees: ₹1,84,843 ÷ 1.7146 = ₹1,07,803.
- Real gain: ₹1,07,803 − ₹1,00,000 = ₹7,803 of extra buying power after 10 years.
- Real return a year: 1.06336 ÷ 1.0554 − 1 = 0.75%.
A nominal gain of ₹84,843 shrinks to ₹7,803 once prices are taken into account. Without tax, the same 8% would have produced ₹2,15,892, or ₹1,25,912 in today’s rupees, so in this case tax reduces the final value by ₹31,049. The result is sensitive to both the tax rate and the inflation rate:
| ₹1,00,000 for 10 years at an assumed 8% | Value after 10 years | In today’s rupees | Real return a year |
|---|---|---|---|
| Tax 20.8% each year, inflation 5.54% (base case) | ₹1,84,843 | ₹1,07,803 | 0.75% |
| Tax 31.2% each year (30% slab plus cess), inflation 5.54% | ₹1,70,879 | ₹99,659 | −0.03% |
| Tax 20.8% each year, inflation 4.9% (ten-year average) | ₹1,84,843 | ₹1,14,564 | 1.37% |
| No tax, inflation 5.54% | ₹2,15,892 | ₹1,25,912 | 2.33% |
At the top slab, an 8% return taxed every year ends slightly behind September 2026’s inflation rate. Regular investing follows the same logic. ₹10,000 a month for 20 years, on the base-case assumptions, adds up to ₹24,00,000 invested and ₹47,32,688 at the end, which is ₹16,09,778 in today’s rupees. Because later payments are made in cheaper rupees, the payments themselves are worth ₹14,71,836 in today’s rupees, so the real gain is ₹1,37,942.
Calculate your real return
Enter a lump sum, a monthly amount or both, the number of years, the annual return you assume, your tax rate on that return and whether the tax is paid every year or once at the end. Inflation starts at 5.54%, the September 2026 CPI figure; change it to 4.9% for the ten-year average, 4% for the RBI target, or a figure that fits your own spending. The results show the final value in the rupees of that year and in today’s rupees, what you put in, and the real gain or loss after tax and inflation.
Where Indian households keep their savings
Most household saving goes into physical assets
According to NSO data in RBI’s Annual Report 2025-26 (Appendix Table 3), the household sector saved 21.3% of gross national disposable income (GNDI) in 2024-25: 13.6% of GNDI in physical assets, 7.0% in net financial assets and 0.7% in valuables. In rupees, RBI’s Handbook of Statistics on the Indian Economy 2025-26, Table 11 puts household saving in 2024-25 at ₹69,00,602 crore. Of that, ₹44,25,126 crore was saving in physical assets, ₹22,57,119 crore was net financial saving (gross financial saving of ₹38,28,361 crore less financial liabilities of ₹15,71,242 crore) and ₹2,18,357 crore was saving in the form of gold and silver ornaments: roughly 64%, 33% and 3%.
Within financial saving, deposits still lead
RBI’s Annual Report says household financial saving is dominated by deposits, followed by provident and pension funds and insurance, with a gradual increase in investment in shares and debentures. The latest year for which RBI’s Handbook, Table 12 splits household financial assets by instrument is 2023-24, using NSO’s National Accounts Statistics 2025. The chart below compares that year with 2013-14. These are the year’s additions to financial assets, not the total stock that households hold.
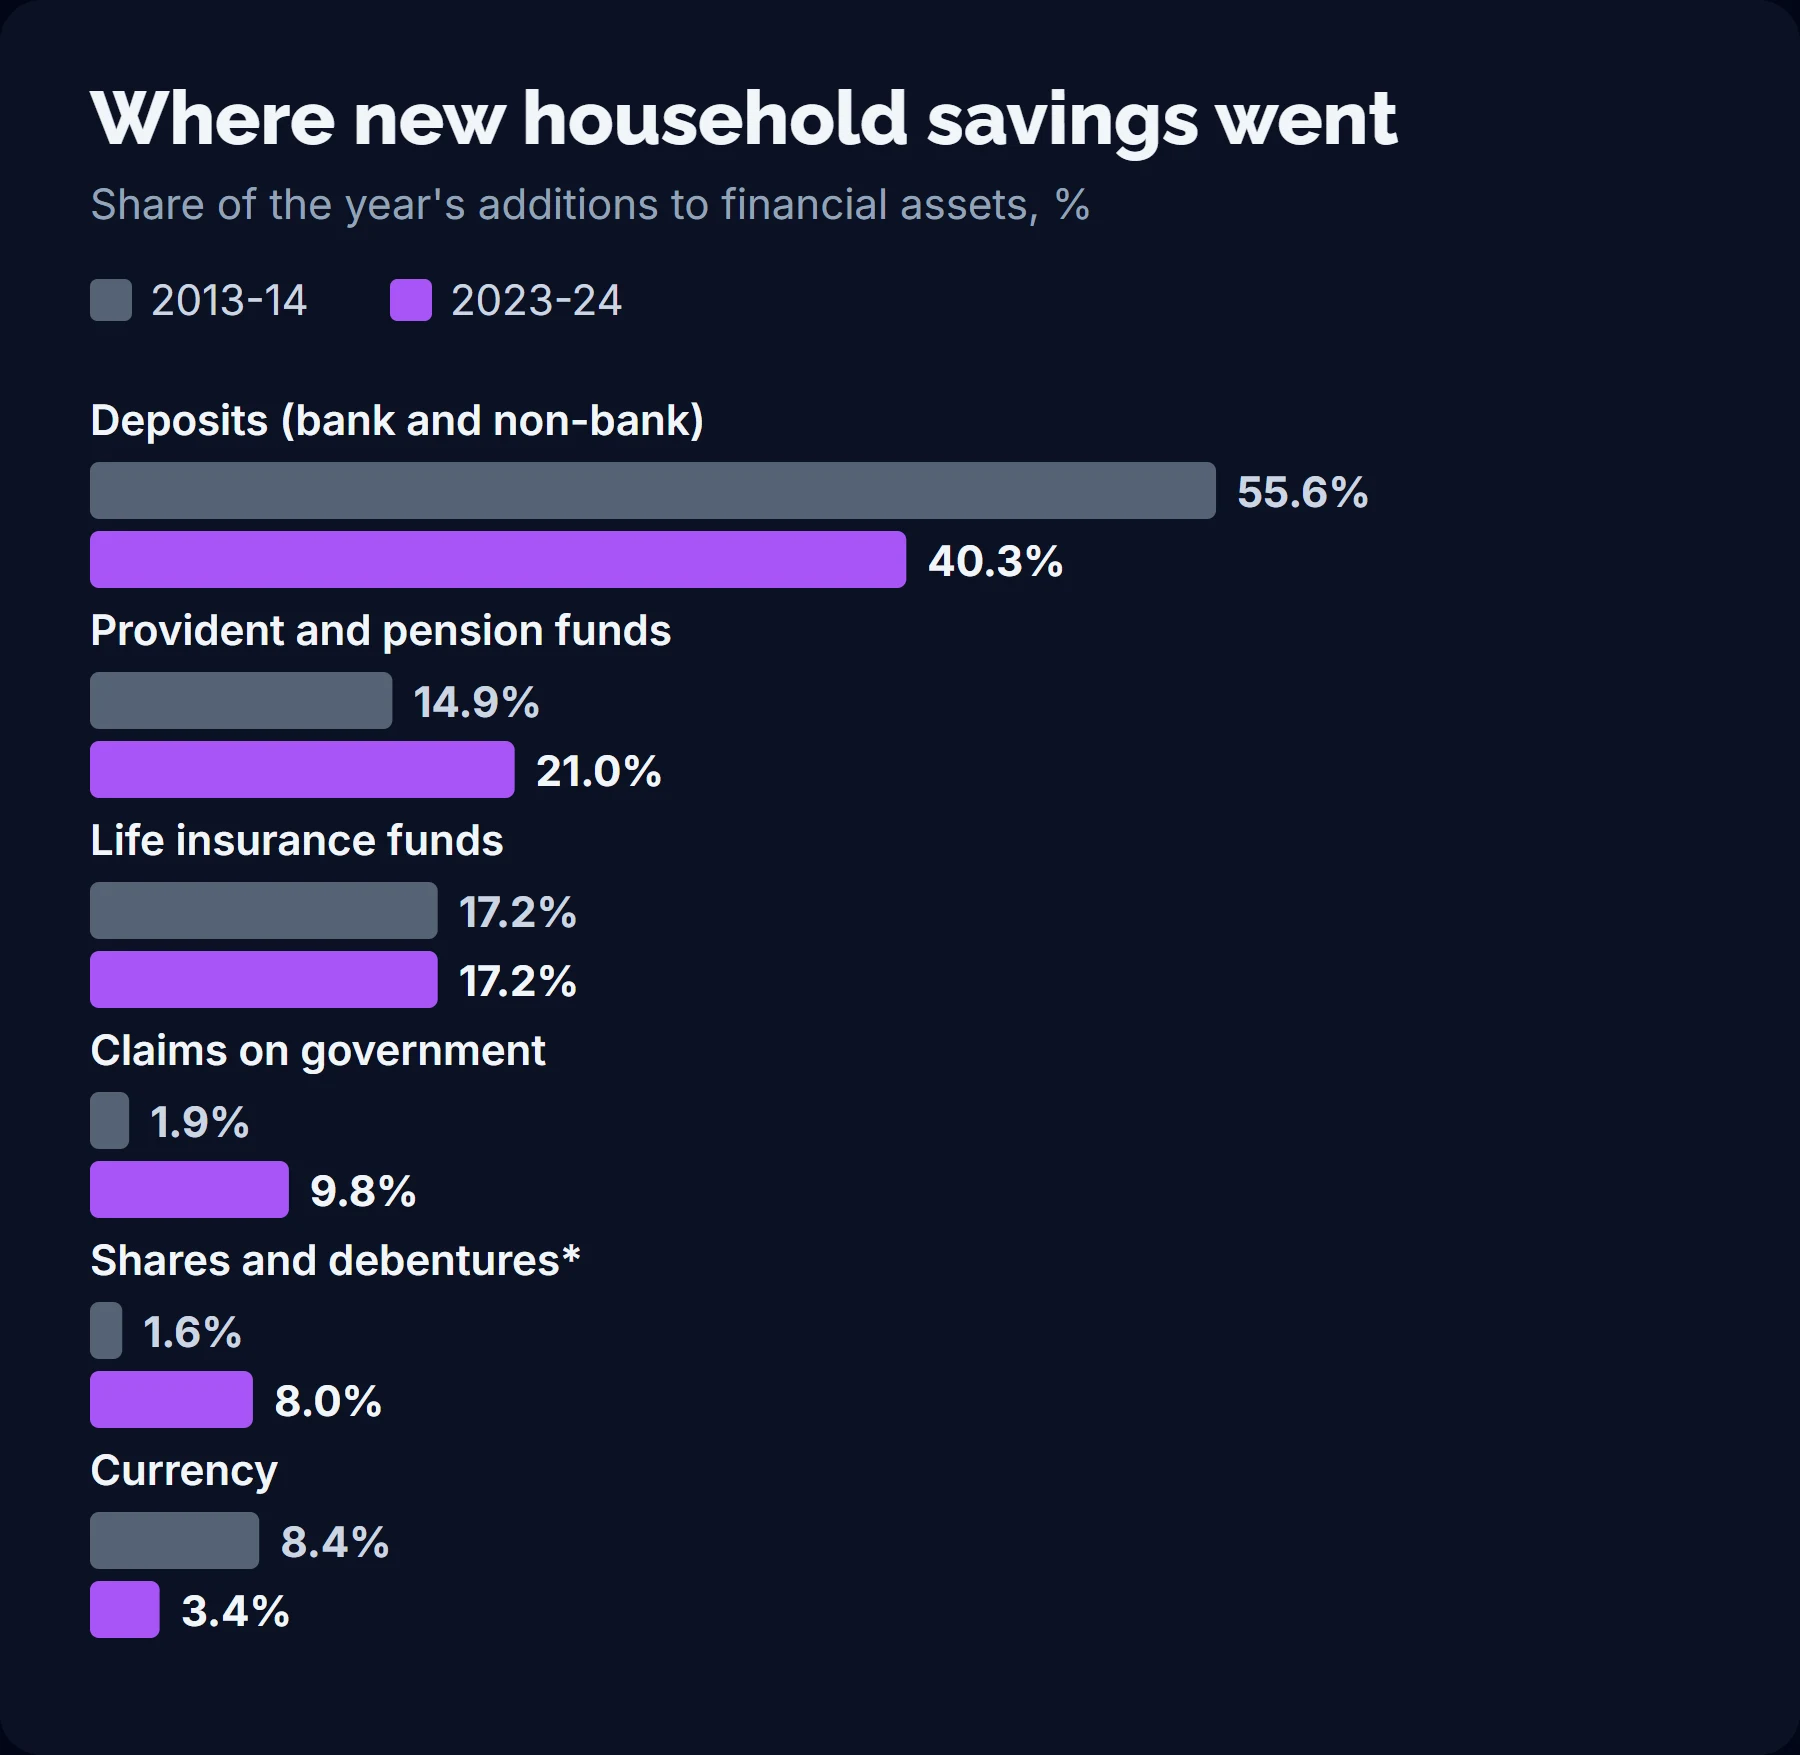
Over the ten years, the share of deposits in new financial saving fell from 55.6% to 40.3%. In 2023-24, households added ₹14,42,142 crore to bank deposits but withdrew a net ₹59,126 crore from non-bank deposits. Provident and pension funds rose from 14.9% to 21.0% of the total, claims on government from 1.9% to 9.8%, and shares and debentures, which in this table include mutual funds, from 1.6% to 8.0%. Currency fell from 8.4% to 3.4%, and life insurance funds held at about 17%. In rupees, the 2023-24 addition to shares and debentures was ₹2,76,070 crore, about a fifth of the amount added to bank deposits.
New borrowing rose, then eased
Gross financial saving is only half the picture, because households also borrow. RBI reports net financial saving as gross financial saving minus new financial liabilities, as the chart below shows.
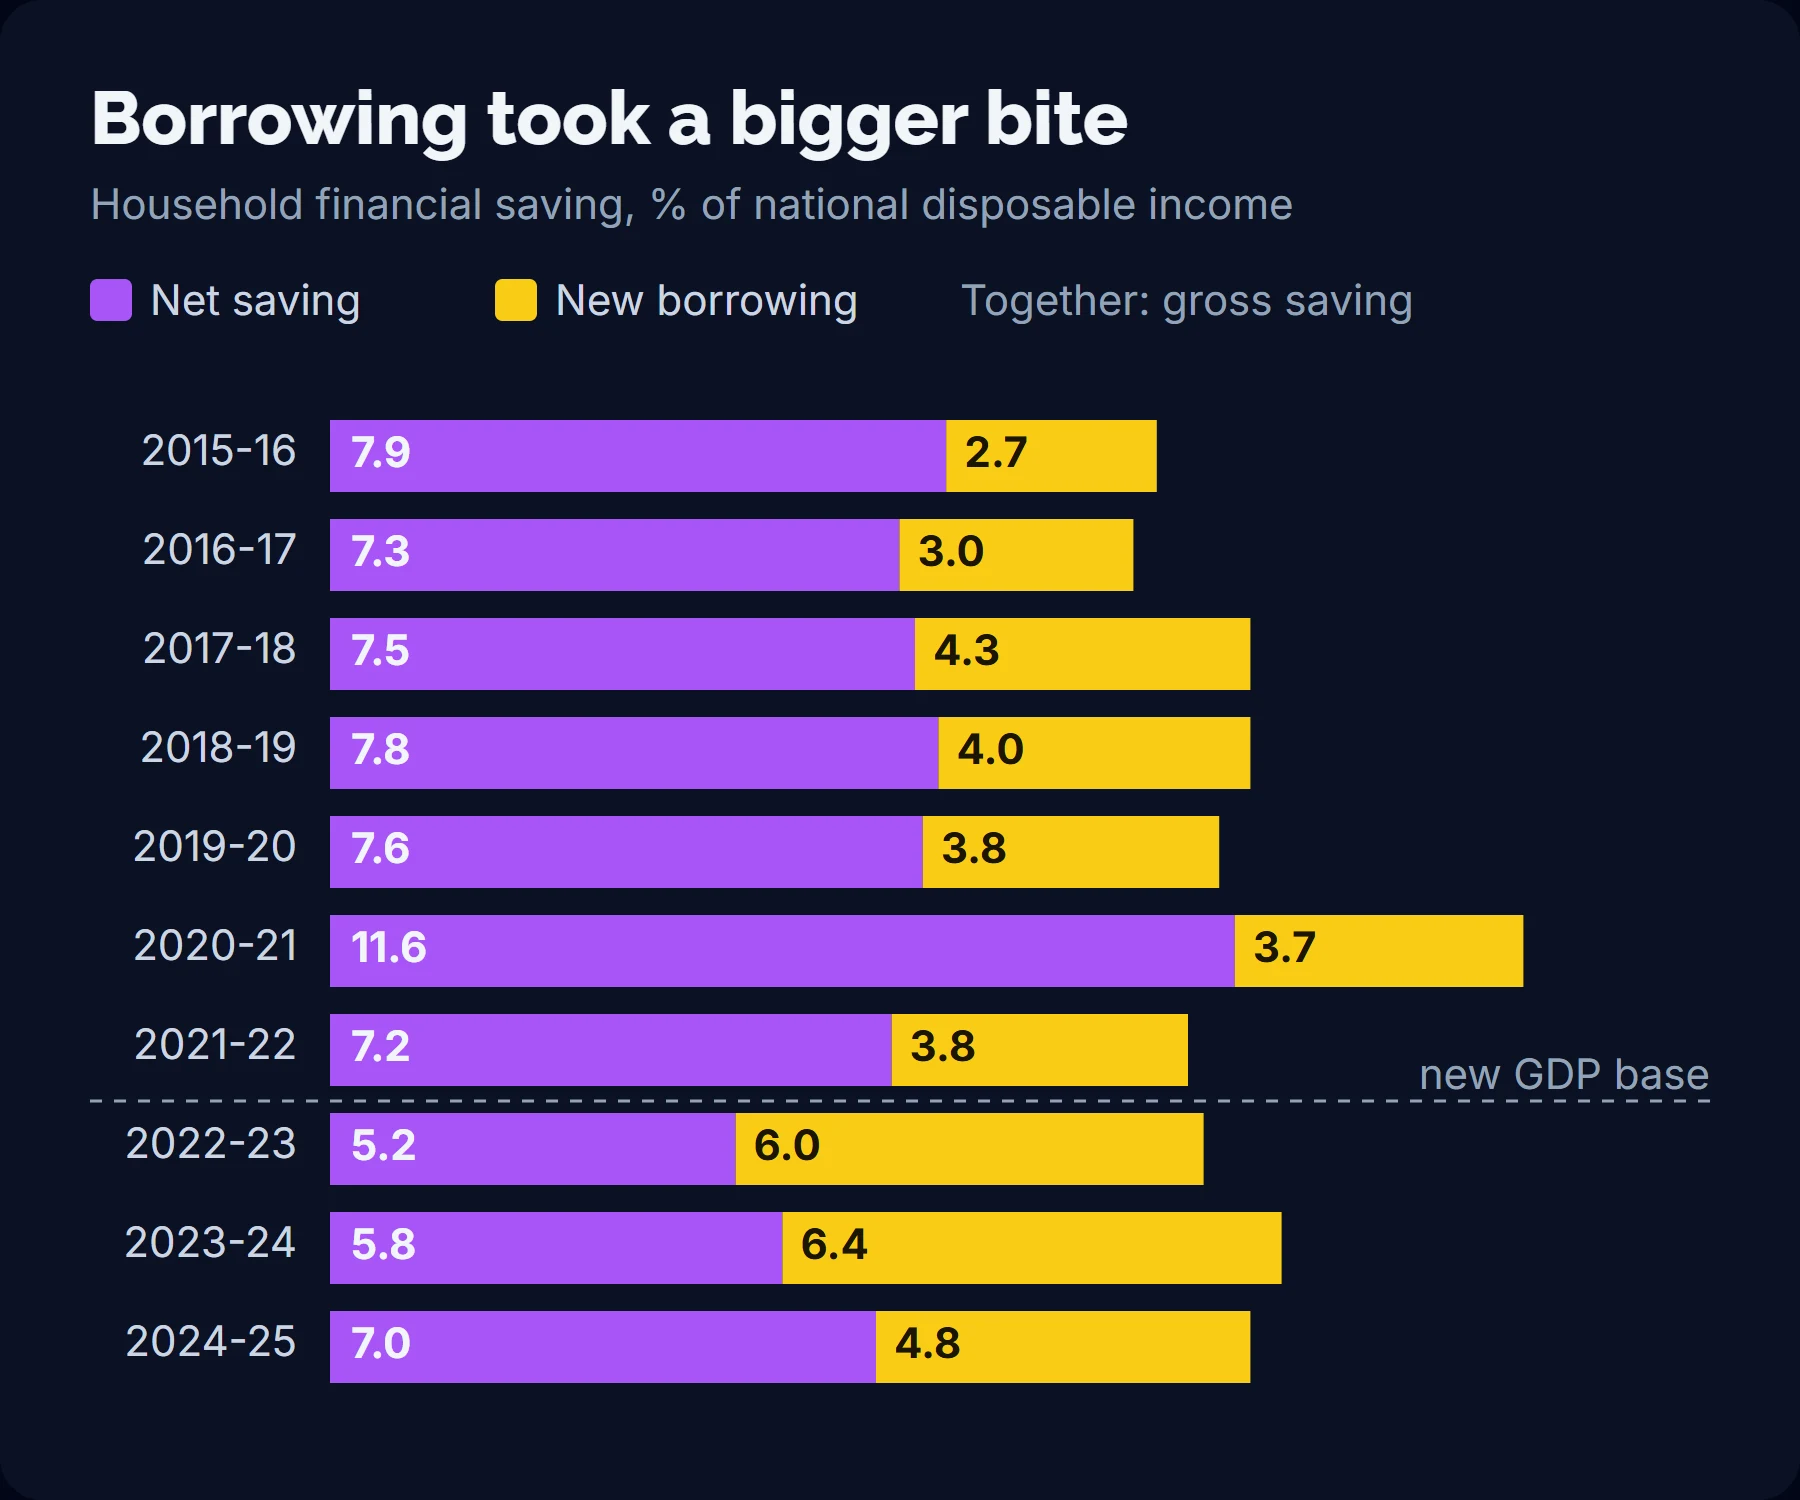
From 2015-16 to 2021-22, new household borrowing ran between 2.7% and 4.3% of GNDI. It rose to 6.0% in 2022-23 and 6.4% in 2023-24, pulling net financial saving down to 5.2% and 5.8%. In 2024-25, liabilities fell to 4.8% and net financial saving recovered to 7.0%, with gross financial saving at 11.8%; RBI’s Annual Report says the decline in liabilities more than offset the moderation in gross saving. Data from 2022-23 are on NSO’s revised GDP base year, so the two parts of the chart are not strictly comparable, but the rise also shows on the older base: the Handbook’s Table 12 records new liabilities of ₹8,99,270 crore in 2021-22, ₹15,96,485 crore in 2022-23 and ₹18,78,999 crore in 2023-24.
RBI also notes that the household sector remained the primary net supplier of funds, with its surplus funds rising to 7.8% of GDP in 2024-25 from 6.4% in 2023-24. In practice, the aggregate figures cannot say whether any particular household is over-borrowed. They do show that, across the country, more of each year’s new financial saving was matched by new loans in 2022-23 and 2023-24 than in the years before.
Small savings rates for October to December 2026
The Government notifies small savings interest rates every quarter. By an office memorandum dated 30 September 2026, the Department of Economic Affairs (Budget Division) kept the rates for the third quarter of 2026-27, from 1 October to 31 December 2026, unchanged from the second quarter. The quarterly memoranda on the Department’s small savings page and the National Savings Institute’s website show the rates carried forward unchanged since the quarter that began on 1 January 2024. The rates themselves are set out in the memorandum of 29 December 2023:
| Instrument (as named in the memorandum) | Rate of interest, % a year |
|---|---|
| Savings Deposit | 4.0 |
| 1 Year Time Deposit | 6.9 |
| 2 Year Time Deposit | 7.0 |
| 3 Year Time Deposit | 7.1 |
| 5 Year Time Deposit | 7.5 |
| 5 Year Recurring Deposit | 6.7 |
| Senior Citizen Savings Scheme | 8.2 |
| Monthly Income Account Scheme | 7.4 |
| National Savings Certificate | 7.7 |
| Public Provident Fund Scheme | 7.1 |
| Kisan Vikas Patra | 7.5 (will mature in 115 months) |
| Sukanya Samriddhi Account Scheme | 8.2 |
The memorandum gives annual rates only. Eligibility, deposit limits, lock-in, how interest is compounded and how it is taxed are set by each scheme’s rules and the Income-tax Act, so the table is not a comparison of products and this piece does not rank them. As a reference point: before tax, every rate in the table except the savings deposit rate is above September 2026’s CPI inflation of 5.54%. A 7.5% return taxed at 31.2% falls to 5.16%, below that figure, while a return that is not taxed keeps its full rate. Which case applies depends on the scheme and on the investor.
Before you invest: emergency fund, insurance and red flags
SEBI’s investor website lists three things to think about before investing (Why One Should Invest): a stable source of income to cover daily expenses, an emergency fund to meet unexpected events such as a job loss, and insurance cover for medical emergencies. RBI’s FAME booklet frames every saving decision around safety, liquidity and return, and asks savers to keep some portion in liquid assets so that money can be withdrawn when needed.
An emergency fund
Neither regulator prescribes a size. SEBI’s booklet, explaining how to set realistic goals, uses the example of saving enough to fund six months of living expenses once debts are cleared. The right figure depends on how stable the household’s income is, its fixed commitments and its insurance cover. An emergency fund exists to be available, so its job is safety and liquidity rather than return. In practice, its cost is the real return it gives up, which is why the inflation numbers above apply to it too.
Where the fund is kept in a bank, deposit insurance matters. RBI’s FAQ on deposit insurance states that each depositor in a bank is insured up to ₹5,00,000 by the Deposit Insurance and Credit Guarantee Corporation, for principal and interest held in the same right and the same capacity. Deposits at different branches of one bank are added together for the limit, while deposits in different banks are insured separately.
Insurance basics
Insurance covers losses that savings cannot absorb. SEBI’s booklet describes term insurance as cover for a fixed period that pays the sum assured to the nominees if the policyholder dies during the term, and health insurance as cover for the insured person’s medical and surgical expenses. IRDAI’s Life Insurance Handbook says that, primarily, anyone who has a family to support and is an income earner needs life insurance; that the cover needed depends on factors such as the number of dependants, debts and mortgages, the lifestyle to be provided for, children’s education and affordability; and that under term insurance no benefit is normally payable if the life assured survives the term.
RBI’s FAME booklet adds a consumer-protection point. It is good practice not to combine savings with insurance, to assess insurance needs and investment requirements separately, and to take an insurance policy or investment product only if you need it; the bank cannot force you to take one. A product sold without explaining its important terms can be the subject of a complaint to the bank and then to the RBI Ombudsman.
Risk, diversification and red flags
SEBI’s booklet lists the risks an investor faces, including market risk, inflation risk (the chance that an investment’s cash flows will be worth less in future because of inflation), liquidity risk and volatility risk. It describes diversification, spreading money across asset classes that react differently to the same event, as the most important component of reaching long-term goals while minimising risk, while noting that it does not guarantee against loss. RBI’s FAME booklet states the trade-off plainly: the higher the expected return, the higher the risk, including the possibility of losing the initial investment.
Both regulators warn about schemes that promise too much. RBI’s booklet asks people to invest or deposit only with entities registered with or regulated by RBI, SEBI, IRDAI, PFRDA or the Government, not to be lured by schemes promising very high returns, and to report entities that default on deposits or money collected under a scheme on RBI’s Sachet portal. Its own illustration of a shady financial product is one offering assured returns of 120% with zero risk.
What to do
- Write down monthly income and spending, and set the saving aside first; both SEBI’s and RBI’s booklets suggest saving before spending.
- Build an emergency fund in a safe and liquid form, sized to your income stability and commitments, before taking investment risk.
- Check life and health insurance cover against your dependants and debts, and decide on insurance and investments separately.
- For each investment, find out how its return is taxed, and use your own rate, including cess, in the calculator.
- Compare options on their return after tax and after inflation, testing more than one inflation figure: the latest CPI reading, the ten-year average and your own spending pattern.
- For long-term goals, start early and invest regularly; as the illustration above shows, time adds more to compounding than a slightly higher rate.
- Spread money across asset classes in line with your goals, horizon and capacity for risk, as SEBI’s booklet describes, and deal only with regulated entities.
- Review the plan once a year, and take advice from a SEBI-registered investment adviser or a qualified tax adviser for decisions specific to you.
Frequently asked questions
What is the latest official inflation rate in India?
All-India CPI inflation was 5.54% in September 2026, a provisional figure released by MoSPI on 12 October 2026. Rural inflation was 6.08%, urban 4.88% and food inflation 7.74%. The October 2026 figure is due on 12 November 2026.
Why does the calculator start with 5.54% and not a long-term average?
It is the latest official figure, but it is a single month. The compound average for 2015-16 to 2024-25 works out to about 4.9% a year, 2025-26 averaged 2.1%, and RBI’s target is 4%. Inflation over your own horizon is unknown, so try several values and look at the range of results.
Is the real return simply the return minus inflation?
Approximately. RBI’s booklet uses the subtraction to explain the idea. The exact real return is (1 + return after tax) ÷ (1 + inflation) − 1, which differs slightly: 6.336% after tax with 5.54% inflation gives 0.75%, not 0.80%.
How are investment returns taxed under the Income-tax Act, 2025?
It depends on the type of income and on your total income. Section 202(1) sets the default slab rates for individuals, from nil up to ₹4,00,000 to 30% above ₹24,00,000, and the Finance Act, 2026 adds 4% cess. Rebates, surcharge, the option to opt out and rules specific to each kind of return can change the result, so check with a tax adviser and enter your own rate in the calculator.
Do the RBI figures show how much wealth households hold in each asset?
No. They measure the flow of saving in a year: what households added to each asset, less what they borrowed. The instrument-wise split in RBI’s Handbook currently runs to 2023-24 on NSO’s older national accounts base, while the totals for 2022-23 onwards in the Annual Report use the revised base year 2022-23. The CPI series also changed base in January 2026. Long comparisons across these breaks are indicative, not exact.
This analysis was written with AI from the official sources listed above and checked against them before publishing. The calculators apply the rules as those sources state them and give estimates, not advice. It is general information, not professional advice: check the sources, or talk to a Chartered Accountant, before acting on it.